
Compound Line Graph Example 1
Compound Line Graph
Definition: It is an advanced version of the multi-line graph. The area between two lines is shaded indicating the size of that part.
You should spend about 20 minutes on this task.
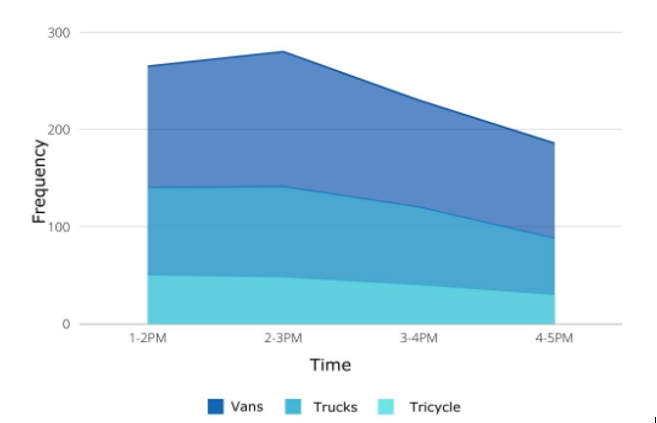
The graph below shows the frequency of 3 kinds of vehicles at different times of day on a road.
Summarize the information by selecting and reporting the main features, and make comparisons where relevant.
Write at least 150 words.
Sample Answer
The given graph shows the frequency of three different kinds of vehicles, which are, vans, trucks and tricycles on a road at different times of the day.
It is clear from the graph that at any point in time, the number of vans on the road are the highest among the three vehicles, followed by trucks and then tricycles. The peak hour of vans and trucks falls between 2-3 pm.
The number of vans on the road increases from 1-2 pm till 2-3 pm and then gradually decreases. The number of trucks on the road remains the same till 2-3 pm after which their number also starts declining. The number of tricycles is highest at 1-2 pm and then it follows a downward trend all throughout the day.
The road in question is dominated by vans for most of the day and trucks are also quite frequent during the afternoon. The number of tricycles are less as compared to the other two types of vehicles.