
Introduction Line Graphs
IELTS line graphs
In IELTS Writing task 1 of the academic section, there will be a visual representation or a diagram on which you have to write a paragraph. One of these visual representations may be pie charts.
Sometimes, you are asked to explain a Line graph. The IELTS line graph shows how data changes over time. These line graphs will have 2 axes, one is X-axis and another is Y-axis.
The X-axis shows the time period and the Y-axis shows what is being measured. The line graph highlights the trends when the data goes up and down. You should take only 20 minutes to complete this task and it should be a 150-word essay.
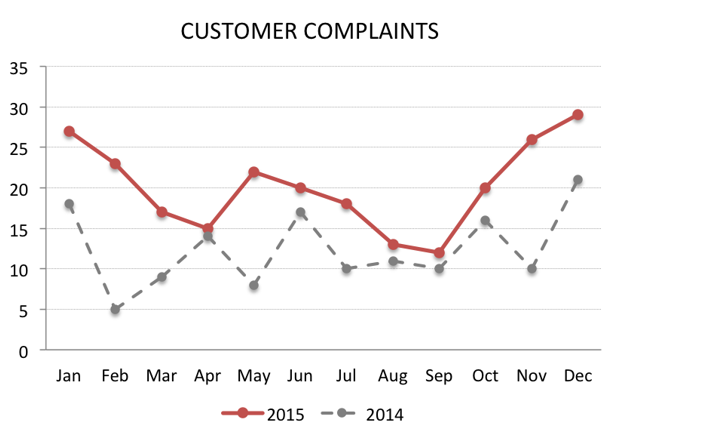
An example:
Types of Line Graphs:
There are three types of line graphs. They are:
- Simple line graph
- Multi Line graph (or) Polyline graph
- Compound line graph
Task 1 of the Academic Writing test challenges you to examine visual data such as graphs, charts, tables, or diagrams, and to succinctly report the key information in your own words. Specifically, you might encounter line graphs, which will typically be accompanied by a title and a key (or legend) to aid in interpreting the data each line represents. Your role is to analyze the graph and provide a clear, detailed summary of the most significant trends and information depicted, without inserting any personal opinions or performing calculations.
When addressing a line graph, you should focus on identifying and conveying the trends it shows. Trends represent the direction or pattern of the data over a specified time period, which could be upward, downward, or stable. It’s important to note the time frame, which could be in days, months, or years, and to recognize any projections into the future if present.
Here are specific instructions for completing Task 1 related to a line graph:
- Examine the graph meticulously to ascertain the most salient information and noteworthy features.
- Compose a coherent and structured overview.
- Corroborate the key points with relevant data.
- Maintain an academic tone throughout.
- Produce a response that is no less than 150 words.
- Aim to complete this task within approximately 20 minutes.
- Focus on the pivotal points, excluding trivial or non-essential details.
- Refrain from performing any calculations or offering personal viewpoints on the presented data.