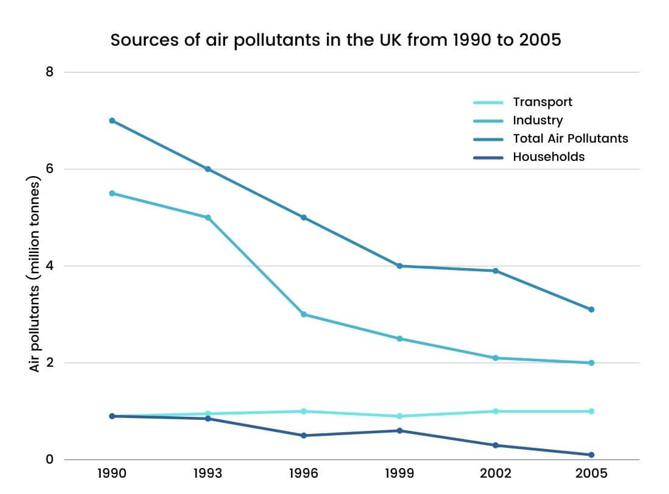
The graph below shows different sources of air pollutants in the UK from 1990 to 2005. Summarize the information by selecting and reporting the main features, and make comparisons where relevant.
Write at least 150 words.